Custom & connectible
We build with data systems and environment in mind — layering intelligence to make your current data more useful and usable.
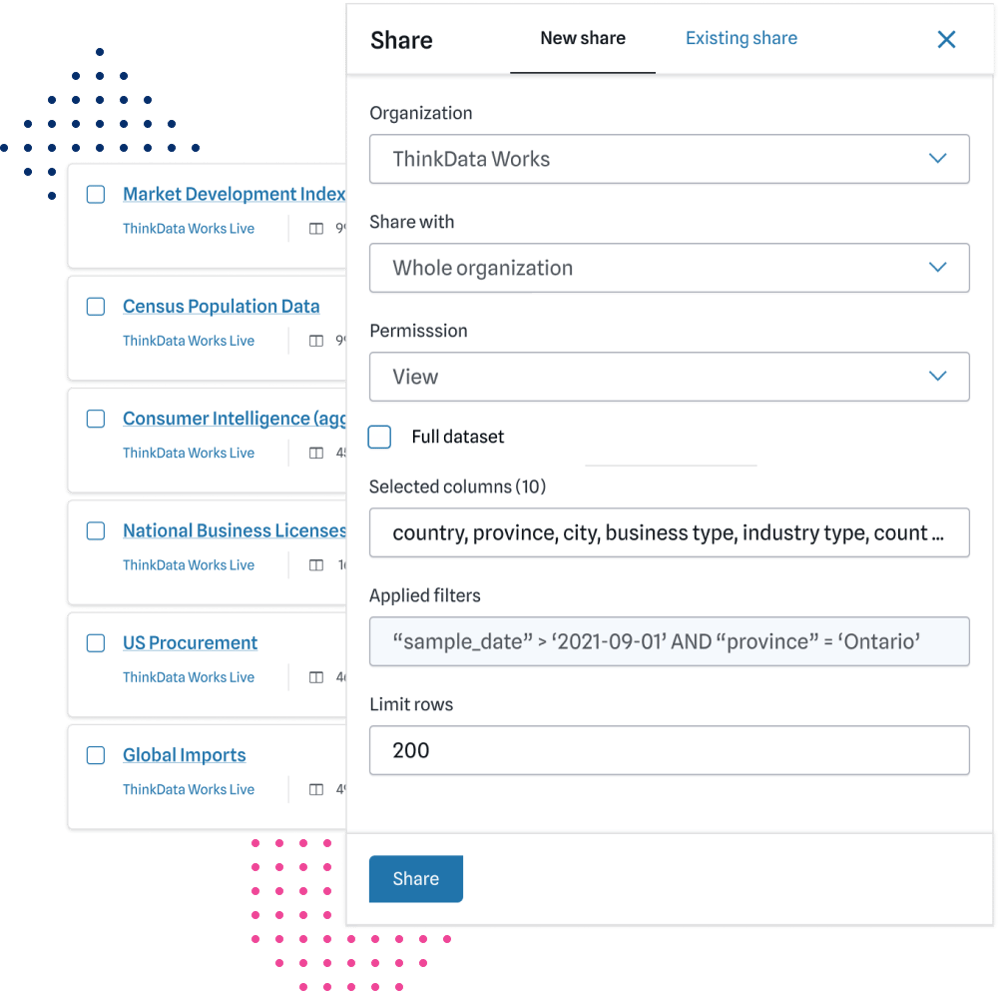
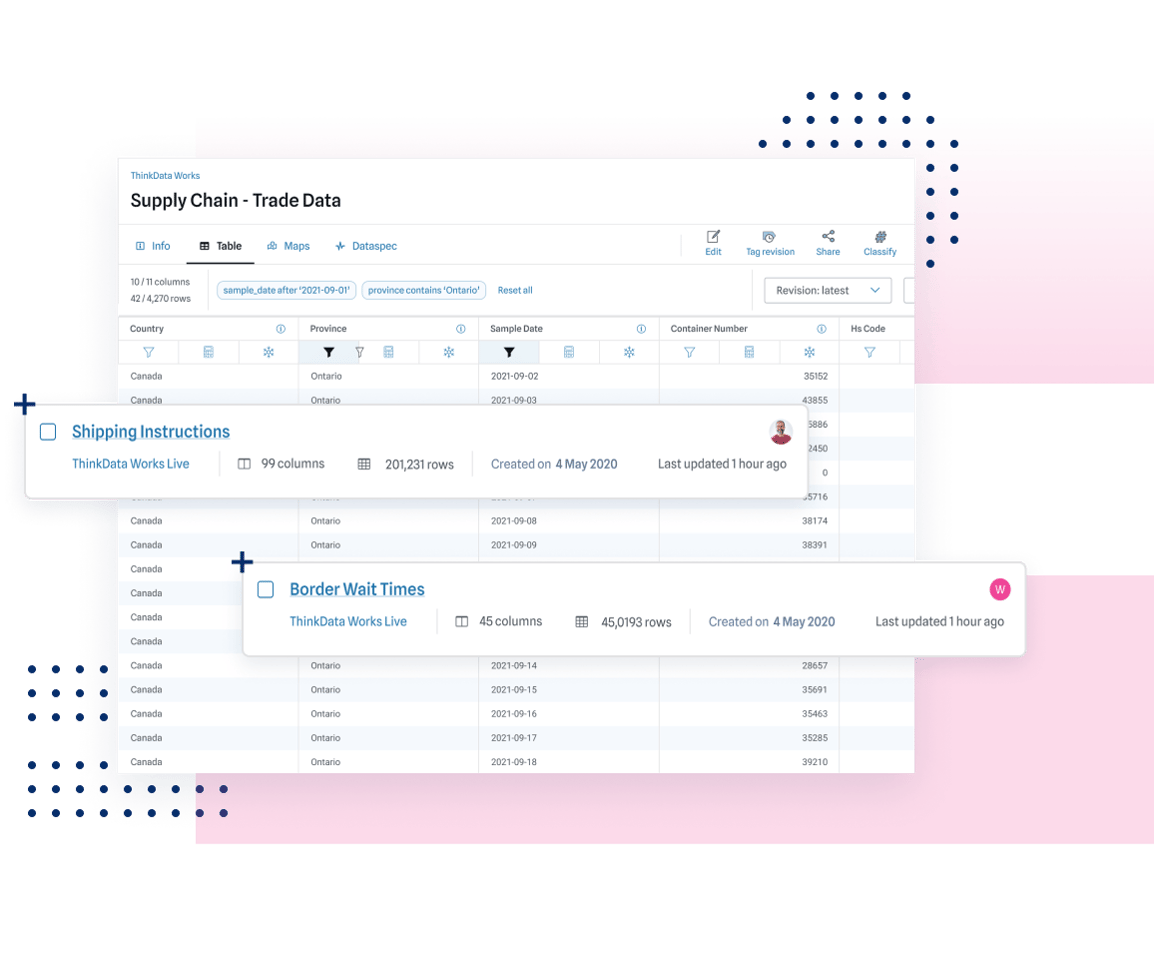
Data’s full potential can be reached when you can combine, refine, and integrate it. ThinkData Works will blend and build custom-fit data feeds that take full advantage of external data. Add new, game-changing layers to your decision science.
We build with data systems and environment in mind — layering intelligence to make your current data more useful and usable.
Unique and specialized data products generate trustworthy, powerful results. Have confidence in your data analytics and strategy.
Leave the heavy-lifting to a company built to handle data from any source. We’ve got the experience and tools for first-class data products and delivery.
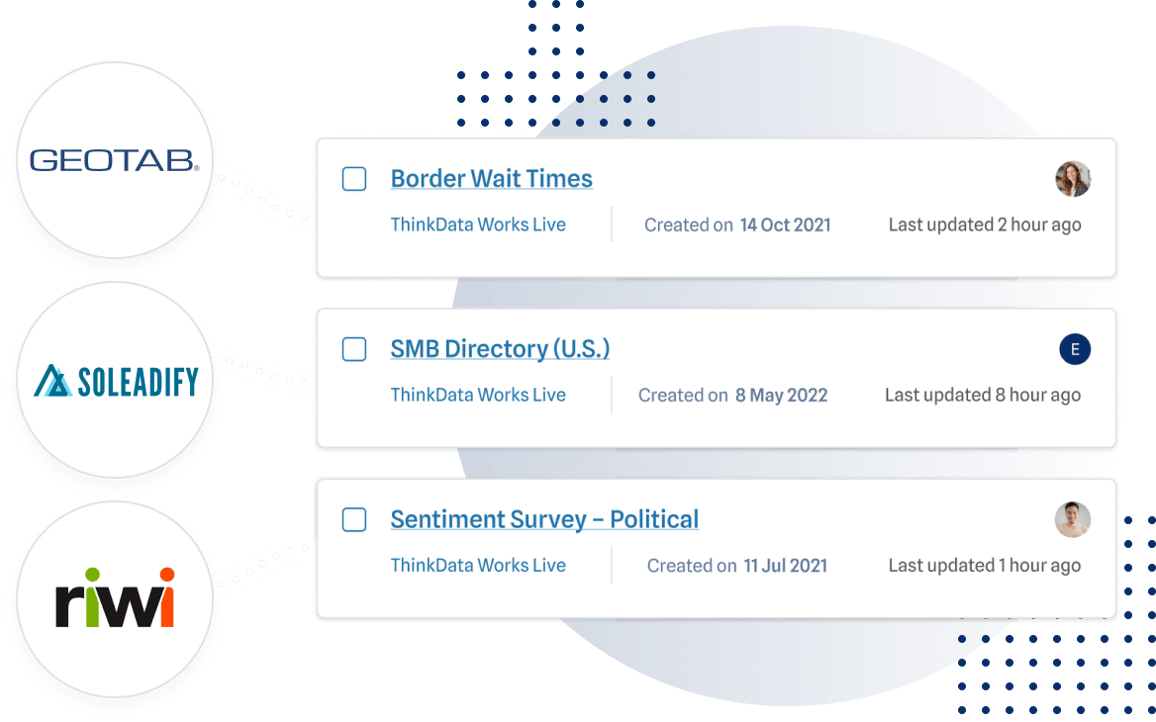
ThinkData Works has a partner network that offers unique and timely intelligence to add value to your data science initiatives.
ThinkData Works delivers enterprise-grade external data feeds to some of the world’s largest organizations in consulting, pharmaceutical, and banking. Book time with our data experts to get powerful and refined insights.