Custom & connectible
We build with data systems and environment in mind — layering intelligence to make your current data more useful and usable.
Need to know what benefit a catalog solution could offer you? Find out with our calculator.
A connected dashboard to show your most valuable and active data assets.
Discover new revenue opportunities with secure data delivery
Level up your data governance program with interactive guides and webinars from industry data leaders.
Data’s full potential can be reached when you can combine, refine, and integrate it. ThinkData Works will blend and build custom-fit data feeds that take full advantage of external data. Add new, game-changing layers to your decision science.

Census data on a common standard for over 40 countries around the world — plus psychographic, sentiment, and intent layers. Get a detailed picture without compromising on privacy.
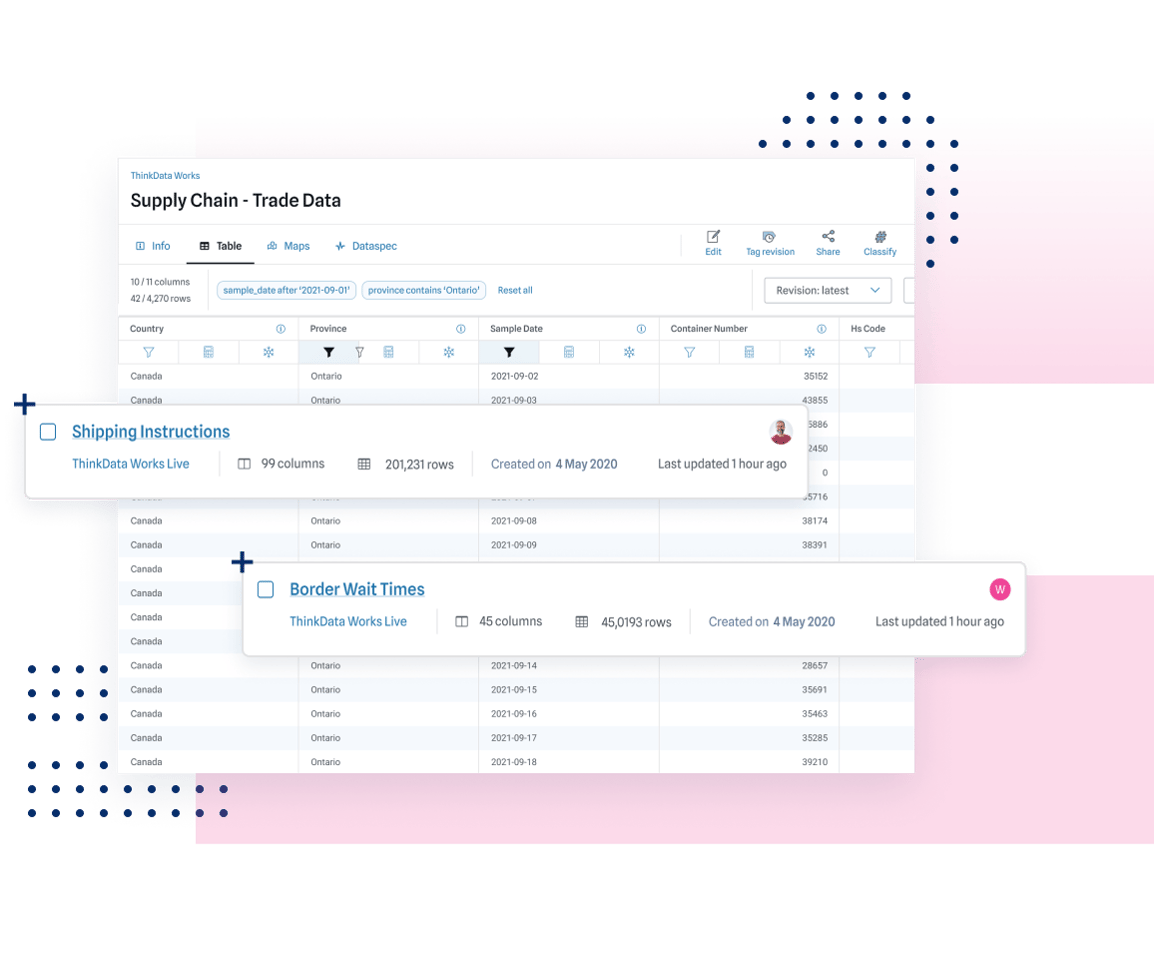
Get a comprehensive look at trade and shipping activity that goes beyond your immediate supply chain. Predict shortages, pivot before your competitors, and understand the relationships between suppliers better than ever.
Many businesses don't appear on traditional directories; SMBs make up a massive share of the market in virtually every sector. Unlock new revenue by understanding the business landscape better than ever.
We build with data systems and environment in mind — layering intelligence to make your current data more useful and usable.
Unique and specialized data products generate trustworthy, powerful results. Have confidence in your data analytics and strategy.
Leave the heavy-lifting to a company built to handle data from any source. We’ve got the experience and tools for first-class data products and delivery.
Organizations that leverage external data consistently outpace the competition. Enrich your data ecosystem and grow your business.
~10%
22%
ThinkData Works’ data engineering and enrichment services offer the flexibility to truly make data your own.
We’ll understand your data needs, and the requirements to make it happen in your data environment.
Our data professionals custom build your data products, tailored to your technical specifications and use cases.
Receive a data feed shared securely on our platform — get direct access to data updates without duplicates or downtime.

ThinkData Works has a partner network that offers unique and timely intelligence to add value to your data science initiatives.
ThinkData Works delivers enterprise-grade external data feeds to some of the world’s largest organizations in consulting, pharmaceutical, and banking. Book time with our data experts to get powerful and refined insights.
